Businesses across sectors see the potential value in knowledge management, but are their investments paying off? To ensure continued benefits, documentation or product knowledge teams must track knowledge management metrics around their content.
To maximize success, teams must move away from solely looking at Google Analytics metrics. These metrics are valuable, but not content-oriented and therefore limited in providing key insights into user needs.
Not sure where to start? This article combines industry research with expert insights from Fluid Topics Analytics Product Owner, Teddy Bouziat.
Together, we identified the eight essential knowledge management metrics for modern documentation teams to track. Right away, Bouziat highlighted the benefits of metrics, noting that “writing technical documentation without document corpus-based analytics is like hiking without a map: you can still use your instincts but are you sure you can trust them 100%?”. Read on to discover the eight metrics and their added value for documentation teams.
What is Knowledge Management?
Knowledge management is the process of creating, organizing, and delivering collective information to employees and customers. The goal is to make critical knowledge readily accessible to the right users at the right time. Effective knowledge management eliminates information silos, driving increased productivity, streamlined employee onboarding, improved customer experiences, and stronger knowledge retention.
Organizations leverage a range of tools, including documentation portals and knowledge bases, to optimize the benefits of knowledge management. These digital hubs serve as centralized repositories for valuable content, such as technical documentation, knowledge articles, FAQs, installation guides, product manuals, and more. Tracking metrics from these platforms is crucial for assessing their effectiveness and ensuring continuous improvement.
What are Knowledge Management Metrics?
Knowledge management metrics are a group of quantitative and qualitative measures that provide detailed insights into the performance of a company’s content. They monitor content usage, interactions, user engagement, and trends to assess the effectiveness of your documentation and measure ROI. The top-of-the-line solutions allow teams to track metrics at both the documentation and topic levels.
Knowledge management metrics offer valuable insights that benefit the whole business, not just technical writers. By guiding smarter content strategies across teams, these metrics help departments keep content fresh and relevant, making it easy for users to find what they need. This improved access to information enhances user experience, builds a stronger brand reputation, boosts customer satisfaction, and gives the business a competitive edge through greater efficiency and responsiveness.
Bouziat elaborated on this value stating that “knowledge metrics provide unparalleled visibility into customer engagement and user needs. Our detailed content analytics help customers make data-driven decisions about how to improve the user experience and optimize their product content.”
What is the Importance of Tracking Your Metrics?
Tracking and analyzing dedicated documentation metrics is essential to maximizing your knowledge management strategy. The benefits from extracting and capitalizing on this data are far-reaching in impact.
- Enhancing employee productivity: Product knowledge teams have an ever-growing to-do list. Dedicated knowledge metrics provide clarity around user needs. This allows the team to prioritize tasks and complete high-value missions first.
- Improving customer self-service: Useful content helps customers autonomously find answers to questions without support agents. In fact, customers love to self-serve with 67% of users preferring these options to speaking to a live agent. Yet Gartner reports that the average success rate for self-service tools is just 14%. Knowledge management metrics provide direct communication between technical writers and users enabling teams to continuously improve content and achieve higher success rates.
- Optimizing costs: Advanced content analytics help businesses target inefficiencies in knowledge delivery making it easier to pinpoint areas for process improvement and optimize resource allocation within knowledge teams. This approach not only streamlines operations but also reduces indirect costs. For example, by improving self-service resources, companies can empower customers to solve issues on their own, ultimately lowering support expenses.
Identifying knowledge gaps: Analytics highlight specific content issues based on where users are struggling. Whether users aren’t finding answers because the content doesn’t exist or because the team needs to add new synonyms or topics, knowledge teams can quickly fill in the information gaps. - Driving business growth: By analyzing metrics such as the usage of Generative AI (GenAI) applications, chatbots, and other features, companies can develop and justify new pricing models based on access to premium content services.
This data provides deep, practical value with actionable insights that translate directly into meaningful business outcomes.
8 Knowledge Management Metrics to Measure and Follow
With these benefits in mind, let’s explore the eight essential metrics your content teams must track to enhance knowledge management.
1. Knowledge Contributions
Products are constantly changing, and new releases are increasingly frequent. For your knowledge platform to provide value to users, your content must reflect the latest insights and product updates. Otherwise, your knowledge base risks inaccuracies and redundancy. This metric provides a holistic view of how engaged and efficient contributors are at maintaining and updating the company’s knowledge system.
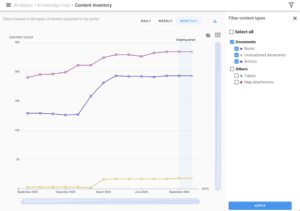
This allows product knowledge teams to monitor how quickly they are preparing new content and making it available to users, which is necessary for an up-to-date, healthy platform.
2: Search Engine Analytics
Knowledge content aims to ensure users find the information they need to answer any questions and provide a positive product experience. Whether the results lack relevance, or the right document isn’t visible, low findability leads to user frustration, product downtime, and skyrocketing support costs.
To address these challenges, search metrics play a crucial role by offering insights into user behavior and content performance. These metrics provide a roadmap of technical documentation actions for a relevant and up-to-date content experience.
There are several metrics to look at under this category. Here are the ones we feel bring the most value.
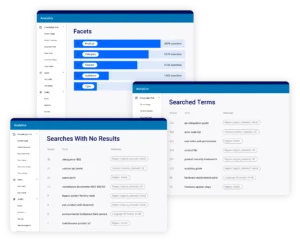
- Terms: Terms are the words or phrases that users search for to find an answer or document. The search terms are often ranked by popularity.
- Facets: Facets allow users to filter search results to narrow down information quickly. When a user selects a filter, they only receive results of content with metadata that aligns with that facet.
- Searches with no results: This shows the search terms users entered that had no matching topic or document results.
These search analytics underscore the needs of your users — essential for optimizing your knowledge content. Knowledge teams have a big backlog of tasks to complete, and these insights into users’ habits, needs, and terminology preferences help prioritize where to start.
With these search analytics, technical documentation teams learn many things:
- How they can update existing content copy to align with user needs
- What synonyms they need to add to increase content findability
- Which taxonomies to create to define how categories relate to one another
- Whether content is tagged wrong, making it difficult to find
- Where knowledge gaps exist, and new documents are needed
3: Usage Metrics
Tracking where users spend their time and how they engage with content is highly valuable for product knowledge teams. By monitoring the relative popularity of documentation, knowledge teams gain insights into user trends and needs.
A documentation analytics dashboard should provide several usage metrics.
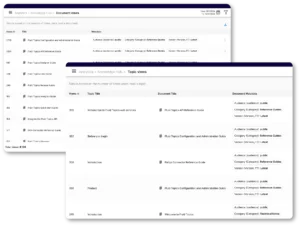
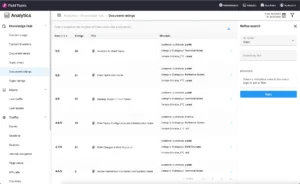
- Document views: This is the number of instances in which users visit a particular document in your documentation portal.
- Topic views: This is the number of instances in which users visit a particular topic in your documentation portal.
- Time spent: It helps companies monitor how much time users spend on a product or within documentation to predict how engaged they were in reading the content.
- Active users: Track the number of authenticated users who access your portal or a public API.
Usage metrics provide technical documentation teams with insights around how a user engages with a product or documentation portal. Content with high traffic of active users or documents with long interaction times should be readily available to ensure a smooth, efficient user experience. This data allows teams to configure their documentation portal or knowledge base homepages to highlight this content and provide quick, direct access.
Alternatively, if search metrics reveal a knowledge gap and the tech writers prepared new content to fulfill that need, they will then want to promote the new documentation. They can test content visibility options and track which lead to the highest views. In parallel, they can collaborate with marketing and customer success teams to promote this useful content across multiple channels and get it directly to the users who will most benefit from it.
Usage Metrics Within Session Journeys
Session journeys provide a detailed look into individual user paths within an organization’s portal. The journey details each cluster of events that a single user completes before logging off or going inactive.
User sessions allow documentation teams to put themselves in the minds of users. For example, say there’s a session where someone views multiple documents and topics, but has comparatively few searches. The team may deduce that they were looking for information that is either hard to find or that is dispersed across multiple documents. Therefore, they can add synonyms and iterate on existing content.
4: User Interactions
Beyond knowing which content customers view, your teams need to determine if and how users actually engage with the content they browse. In the words of Fluid Topics Technical Writer, Clément Guillaume, “there is no better proof that a document was useful to the end-user than seeing that they engaged with the content, whether it be sharing a link or saving it to their personal collection for future reference”.
There are several user interactions to track that underscore which types of content bring the most value to users.
- Bookmarks: A bookmark is a saved shortcut that allows users to instantly access their most important topics.
- Personal Books: Personal books are ways for authenticated users to personalize documentation. They can mix and match their most relevant topics to create custom documents that include only the information they require, without any unnecessary content.
- Shared Links: This metric tracks how many users shared a specific document or topic.
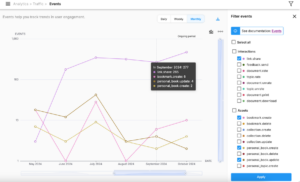
Tracking how users interact with and save content for frequent use helps knowledge teams understand which information is the most important. This confirms the value of existing content, and ensures teams recognize that any updates to frequently saved topics need to be a priority for tech writers.
Knowledge teams can also use this information to reevaluate how visible the most popular topics are. If some of these documents and topics are harder to find, they might consider adding shortcuts to the content on their portal homepage.
5: Device Types
Not everyone accesses information in the same way. That’s why device type metrics are just what they sound like — data around the percentage of display types (desktop, tablet, or mobile) used to access a specific knowledge hub.

Device analytics provide insights into what kind of users are accessing which knowledge portals, and which kinds of content need to be better adapted for certain devices. Access to this granular data allows teams to make clear decisions on how to adjust the design and responsiveness of documentation and non-textual content.
For example, knowledge teams may notice that users access technical documentation portals via mobile devices. Perhaps this is due to the number of field technicians performing onsite maintenance procedures. In that case, technical communication teams can determine which images or diagrams important for field services should be resized for optimized mobile use. They can also reconfigure the portal homepage to optimize resource prioritization and presentation for mobile devices to enhance the user experience.
6: Ratings and Feedback
User ratings highlight the effectiveness of content at the topic and the document level. They may be in the form of awarding a number of stars out of five or as simple as choosing a thumbs up or thumbs down.
Alternatively, your team can enable users to submit written feedback on topics or documents. Open-ended comments may contain valuable suggestions, positive feedback, or questions.
These metrics bring immense value because they remove the guess work for knowledge teams seeking to interpret how users feel about documentation. Ratings and feedback provide direct communication on how effective content is at answering questions. This filters technical writer priorities around which content to modify or promote.
7: Generative AI Profile Activity
89% of AI decision-makers report their companies are expanding, experimenting with, or exploring the use of Generative AI. When it comes to product documentation, companies are designing new engaging AI content experiences for users:
- Summarize documents or topics
- Create a list of tools and parts needed for a maintenance procedure
- Get an explanation of the purpose of a chunk of code
- Get a step-by-step list of instructions
- Other GenAI content experiences
The goal is to harness GenAI to create opportunities that get users the answers they need faster. As teams integrate these applications into their user journeys, it’s important to track how often users engage with new AI tools.
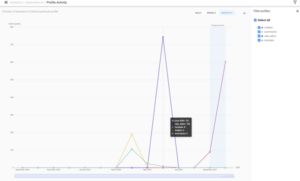
By measuring the usage of each GenAI content experience, knowledge teams can gauge their popularity and learn about user needs. Are users mostly accessing documentation for field services and therefore they use GenAI to extract the tools and parts they need from a repair manual? Maybe developers are confused and need the GenAI code explainer to better understand how to render a product interoperable. Or perhaps product installation is complex, leading to a spike in generated lists of step-by-step instructions.
8: Case Deflection and Costs Saved
Case deflection, or ticket deflection, is a customer support strategy aiming to reduce the volume of support requests by helping customers autonomously find answers through self-service channels.
Companies often implement case deflection widgets in places like customer portals or knowledge bases. These widgets recommend self-service content tailored to the user’s specific issue. Users can explore these resources and try to resolve the problem on their own. When the content is helpful, the user may avoid submitting a support ticket.

By tracking case deflection, companies can evaluate the ROI of their self-service tools. This is done by calculating the support costs saved through deflected cases – essentially, the number of cases avoided multiplied by the cost of handling a support ticket. This not only demonstrates the value of product content in assisting users but also reduces support costs by empowering customers to resolve issues independently. For technical writers, these metrics offer valuable feedback on how well their content is providing clear, actionable solutions to users.
How Can Companies Track Advanced Content Metrics?
By tracking these eight metrics, product knowledge teams can enhance the user experience and boost their corporate KPIs.
Companies looking to implement and track knowledge management metrics should consider an Enterprise Knowledge Platform like Fluid Topics. Fluid Topics enhances data tracking by centralizing content from across all areas of your business, not just technical documentation. This approach provides a holistic view of your organization’s knowledge, bringing together information from various sources and formats into one unified hub.
With Fluid Topics, you gain access to all the dedicated knowledge content analytics listed in this article. Available from one central administrative hub, these metrics provide valuable insights into user behaviors and needs. As a result, product knowledge teams ensure the continuous improvement of their content. Our platform captures the precise details and context of each user interaction, search query, and content engagement. With next-level, content-centric, and user-focused analytics, your teams will be equipped to make data-driven decisions.
Don’t just take our word for it. Fluid Topics customer, Hexagon, leverages our dedicated content analytics to increase content accuracy. “Those analytics provide great insights that we can use to directly improve the quality of our doc—insights that web analytics alone can’t provide,” says Lonnye Yancey-Smith, Executive Manager at Hexagon’s Asset Lifecycle Intelligence Division.
Hexagon’s documentation teams also get precise, actionable content usage metrics. “When we see that people spend a lot of time on a particular topic, it raises a flag: it might mean that the documentation needs attention because it’s hard to use, or that the product itself needs attention,” Yancey-Smith adds.
Final Thoughts on Tracking Knowledge Management Metrics
To measure and improve the effectiveness of your knowledge management content, your teams need the eight metrics outlined above. These insights will provide a direct link between users and tech writers, promoting continuous optimization. Furthermore, these metrics provide direct proof of the ROI and value of your product knowledge content.
A robust solution like Fluid Topics provides everything needed to create a centralized knowledge hub for enterprise content and track its performance. With 65% of businesses looking to transition to data-driven decision-making from intuition-based by 2026, there’s no better time to start tracking your knowledge management metrics.
Latest post


